
Debugging C++ compiled to WebAssembly
by Hristo Iliev |
Published on
category C / C++
As a continuation of my previous post about how to compile C/C++ projects for the web, I will discuss here how to debug those applications. If you want to get familiar with the whole compilation process first do make sure to check out the first post “Programming a C++ game for the web (Emscripten)“. If you’re already familiar with the topic you can jump straight into debugging WebAssembly.
Table of Contents
- Introduction
- Installing the Chrome extension and setting up Chrome
- Compiling the project with debug information
- Debugging
- Conclusion
Introduction
Every programmer that you meet has written bugs. There is no exception to this rule. Sometimes you forget a variable, sometimes you misspell, and sometimes it’s just the computer that executes commands differently than what you expect. For sure when compiling for the web it could just be a port of an application that you already tested on your local machine. But it isn’t always the case. In some situations, you will have to fix a problem that only appears on your web port or that could be even your main workflow.
So this is why you will need to have the option to step through the code and see variables and their values. Maybe if some code is even executed. And it can become really hard to do this through trace messages and logging each variable. How nice it would be if you could debug like you debug JavaScript or C++ code on native applications.
Well, it is all possible and this article just expands upon the official method that Google itself provides in its Chrome browser.
Installing the Chrome extension and setting up Chrome
This is a really short process. To set up your Chrome browser for debugging you will need two things. The first one is the official debugging dwarf extension – goo.gle/wasm-debugging-extension, and the second is to enable some experimental debugging flags in the developer settings.
To enable WebAssembly debugging you need to go to the DevTools Experiments. Open Chrome DevTools, click the gear (⚙) icon in the top right corner of DevTools pane, go to the Experiments panel, and tick WebAssembly Debugging: Enable DWARF support.
Compiling the project with debug information
In the last article I wrote about how to port your CMake project for the web I showed a method to modify the compile tags:
if (EMSCRIPTEN)
    if(CMAKE_BUILD_TYPE STREQUAL "Debug")
        set(CMAKE_C_FLAGS "${CMAKE_C_FLAGS} -g")
        set(CMAKE_CXX_FLAGS "${CMAKE_CXX_FLAGS} -g")
    endif ()
endif ()
These two lines of code will set the flags to their previous value plus anything we add to the right. We need to add one new flag “-g”. That will tell the compiler to preserve all the debug information in dwarf format when compiling our project. The Chrome browser will then be able to read this information up and provide our source file for debugging WebAssembly in their debugging toolset.
Debugging
The next step of course is to host your project somewhere. Then open up the DevTools as if you want to debug JavaScript. This time though you will also have an additional section with the path to your C++ files. There you can break inside them and check different variable values and step through the code.
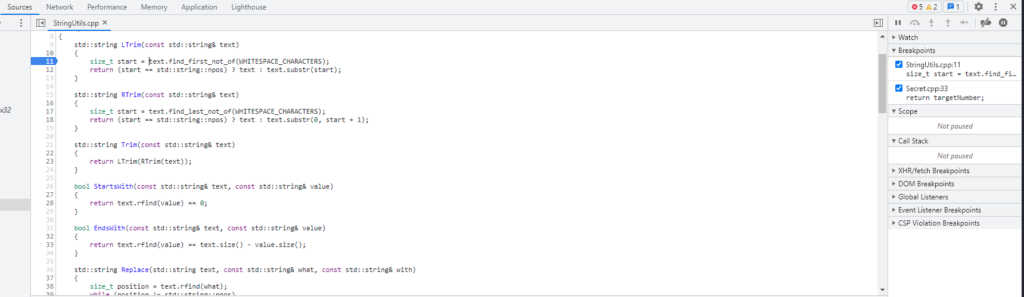
To do that you open up DevTools and go to the sources tab. There you should find a “file://” section on the left and inside will be the path to your project root folder. Select any header or source file and you will be able to put breakpoints and debug it:
Conclusion
It is as simple as that. I decided to keep this article short to reduce the complexity and only add upon the previous article. Debugging is a really crucial process of development. If a certain platform or language doesn’t provide it – people will just stay away from that platform. So I just wanted to raise more awareness of how you can do this process. This way you will be able to develop some great projects for the web using your favorite low-level C/C++ language.
If you want to read the original article provided by Google you can find it here – https://developer.chrome.com/blog/wasm-debugging-2020/
If you’ve followed my setup on creating Godot games with GDNative and CMake then this approach for debugging your code on the web will also work for debugging your GDNative games.

Leave a comment