UPDATE: NVIDIA Nsight Graphics 2023.3 and later feature the new Real-Time Shader Profiler, the first temporal sampling profiler for GPU shaders. This profiler enables you to examine the most expensive shaders at each moment in your frame. For more information, see GPU Trace UI in the Nsight Graphics User Guide.
A less well-known but cool feature of NVIDIA Nsight Graphics is the Shader Profiler. This enables you to find hot spots in your shaders that can help you to direct optimization efforts. It can give you insights into why performance is sometimes not what you might like.
In this post, we use the NVIDIA Nsight Graphics Trace Analysis tool to identify a potential limiter and then use the Shader Profiler to dig deeper to find and fix an issue.
Step 1: Start with the GPU Trace Analysis tool
We always recommend starting with the Nsight Graphics GPU Trace tool rather than diving straight into the shader profiler. That way, you can understand what the performance limiters of any given DX12 or VK workload are. For example, there’s no point trying to fine-tune your shader if the real problem is that you have low GPU utilization because you have lots of tiny dispatches with barriers between them all.
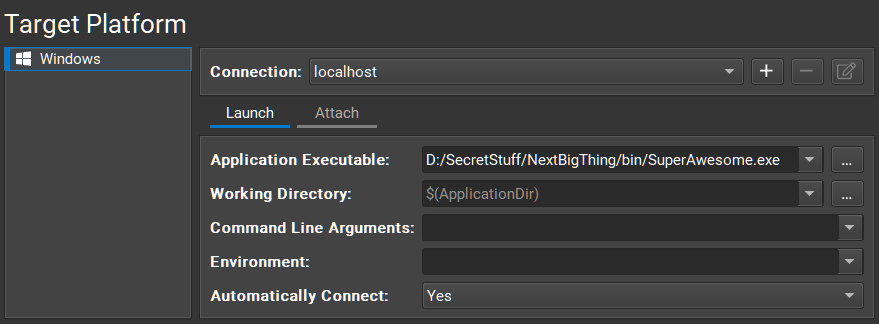
First, set up a connection to the app to be profiled. Choose Connect and fill in the required parameters for launching your game (Figure 1).
Select GPU Trace as the activity, with Metric Set configured to Advanced Mode Metrics. Using Advanced Mode Metrics requires a stable and consistent frame because the analysis runs over several passes over several frames. If your application doesn’t meet these requirements, you can use the Nsight Graphics built-in C++ Capture tool to capture a frame of your application and create a new EXE that replays the same frame repeatedly.
Choose Launch GPU Trace to launch your application. When you reach a frame that you’d like to capture, choose Generate GPU Trace Capture or press F11.
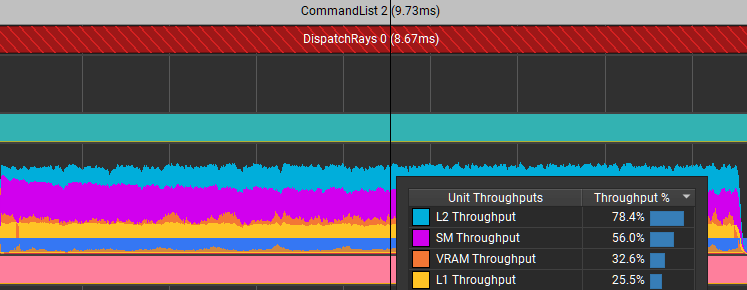
When the capture is complete, stop the application and open the trace. Choose Trace Analysis. In the Analysis panel of GPU Trace (Figure 2), double-click or hover over the marker for the range to analyze, in this case, DispatchRays[0]:
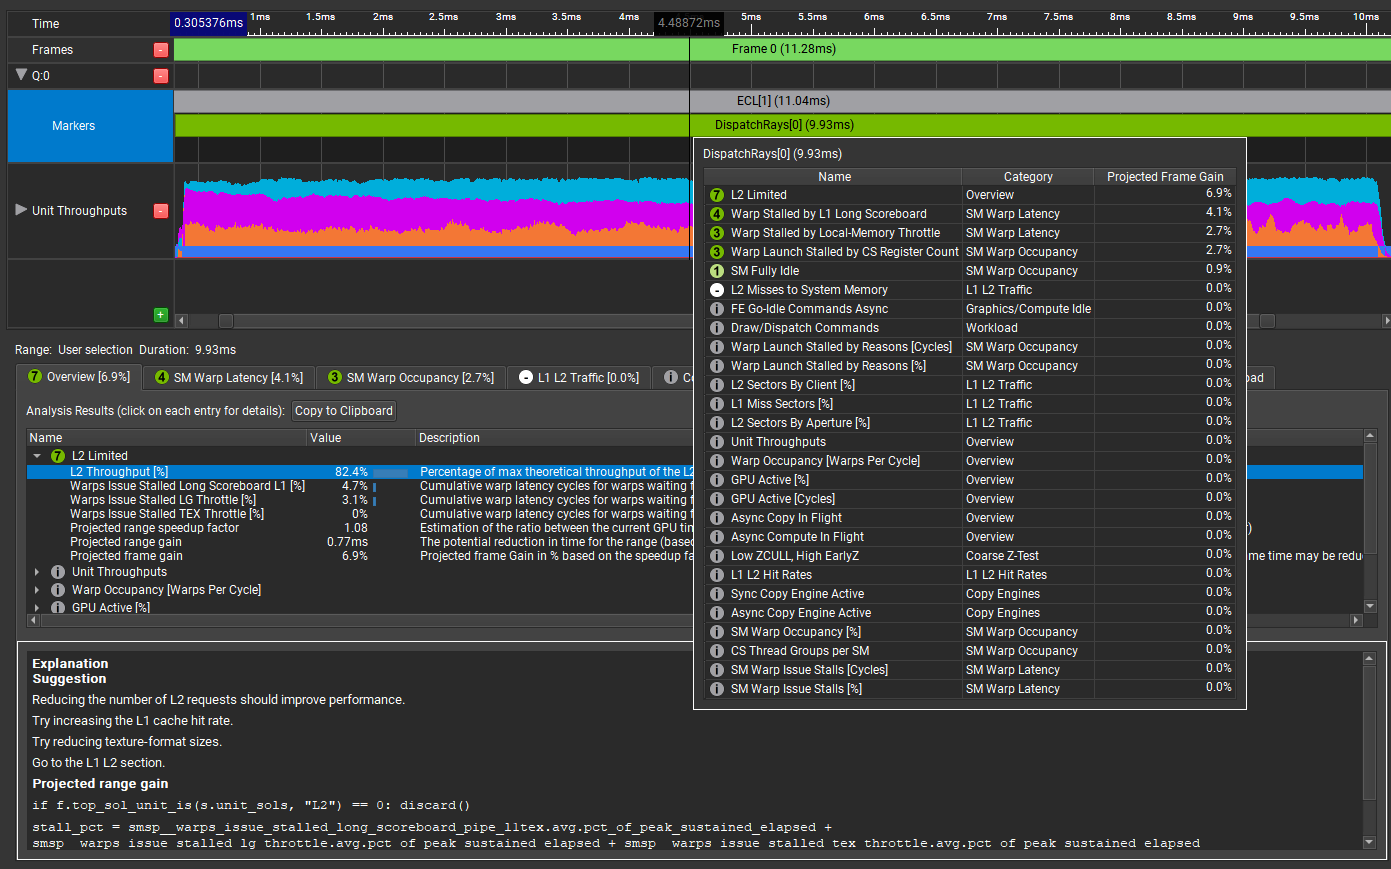
The tooltip presents a compact view of all performance gain opportunities that the tool has detected in this GPU workload, sorted by their projected GPU frame-time gain. The workload has the following limiters:
- L2 Limited: Being L2 limited might be indicative of a problem. With knowledge of the workload, it’s not necessarily something that you would expect.
- Warp Stalled by L1 Long Scoreboard: This is a common reason for warps to be stalled, often due to texture fetches. If there is not enough work between a texture lookup being initiated and the result of the lookup being used, then the warp is stalled until the texture lookup is satisfied.
- Warp Stalled by Local-Memory Throttle: Local memory is ‘thread local’. It’s memory that is local to each thread, as opposed to group-shared memory that is shared between all the threads in the thread group. It’s unusual for a shader to need any local memory, so this is interesting. And what does local memory throttling mean? There’s more to learn here.
Choose SM Warp Latency and Warp Stalled by Local-Memory Throttle.
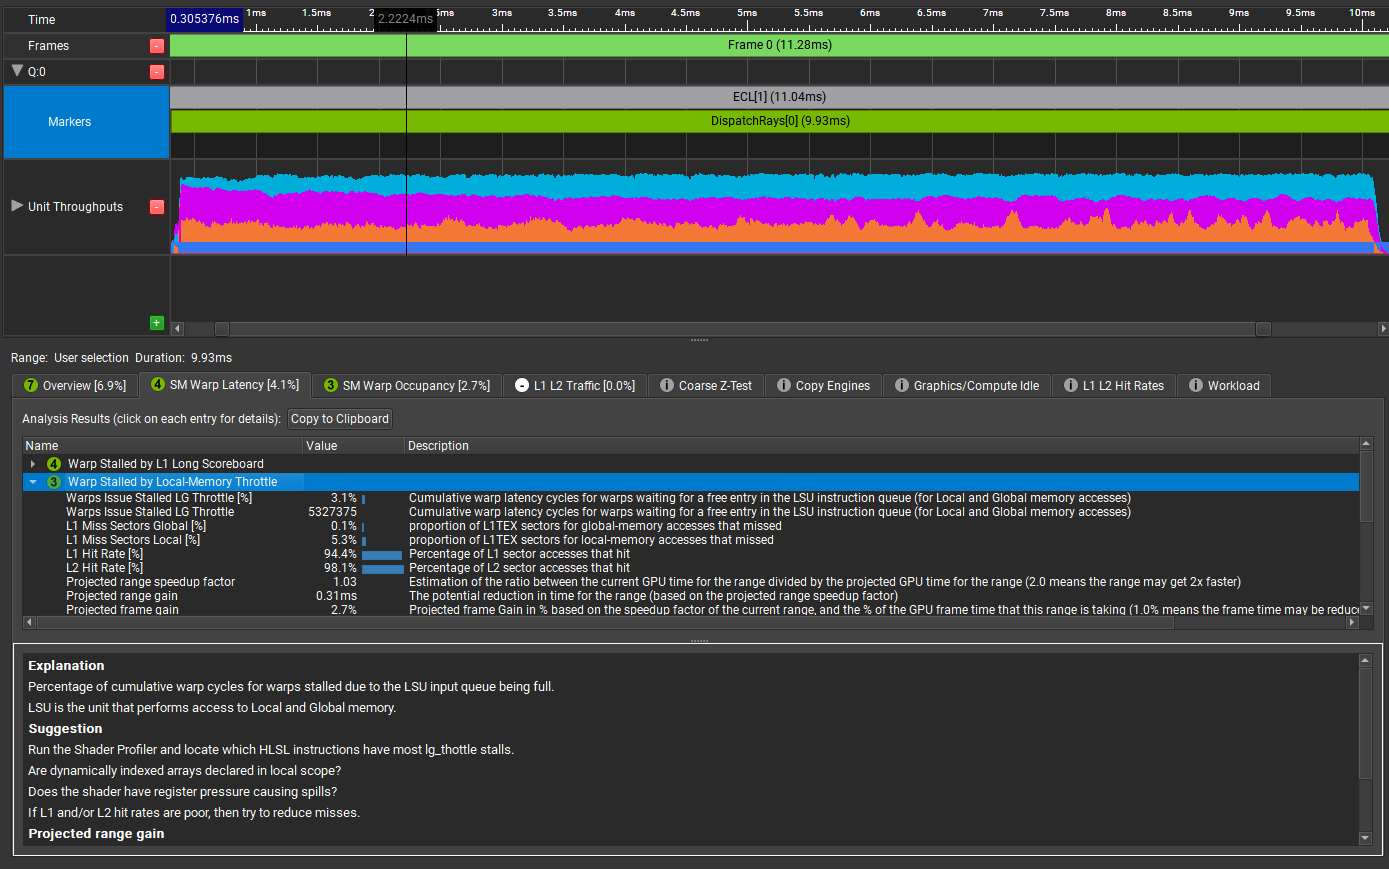
The Explanation window gives a more meaningful description of the problem, with some helpful suggestions. It suggests launching the Shader Profiler to locate the specific HLSL instructions that have lg_throttle stalls.
Step 2: Switch to the Shader Profiler
Before you use the Shader Profiler, it’s important to make sure that Nsight Graphics can get access to symbols for your shaders. The easiest way to achieve this is to make sure that the shaders are compiled with the /Zi option, and embed the symbols in the shader binary.
Sometimes it’s preferable to configure the compilation so that the symbols go into an external PDB file. In that case, be sure to specify the correct path under Tools, Options.
When Nsight Graphics can see the shader symbols, it can map locations in the shader back to the source code, which makes it far easier for you to tell what’s going on. If Nsight Graphics doesn’t have access to symbols, then you can only see the shader disassembly (for example, DXIL).
The Shader Profiler is part of the Frame Profiler. Connect to the application again but this time, choose Frame Profiler under Activity. When you choose Launch Frame Profiler, the application should launch with this HUD (Figure 4) on top of it.
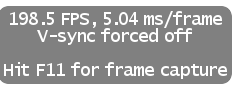
Navigate to the part of the application to profile and press F11 to capture a frame for analysis. From here, choose Profile Shaders in Nsight Graphics. This runs a short sampling session and then presents you with a summary view (Figure 5).
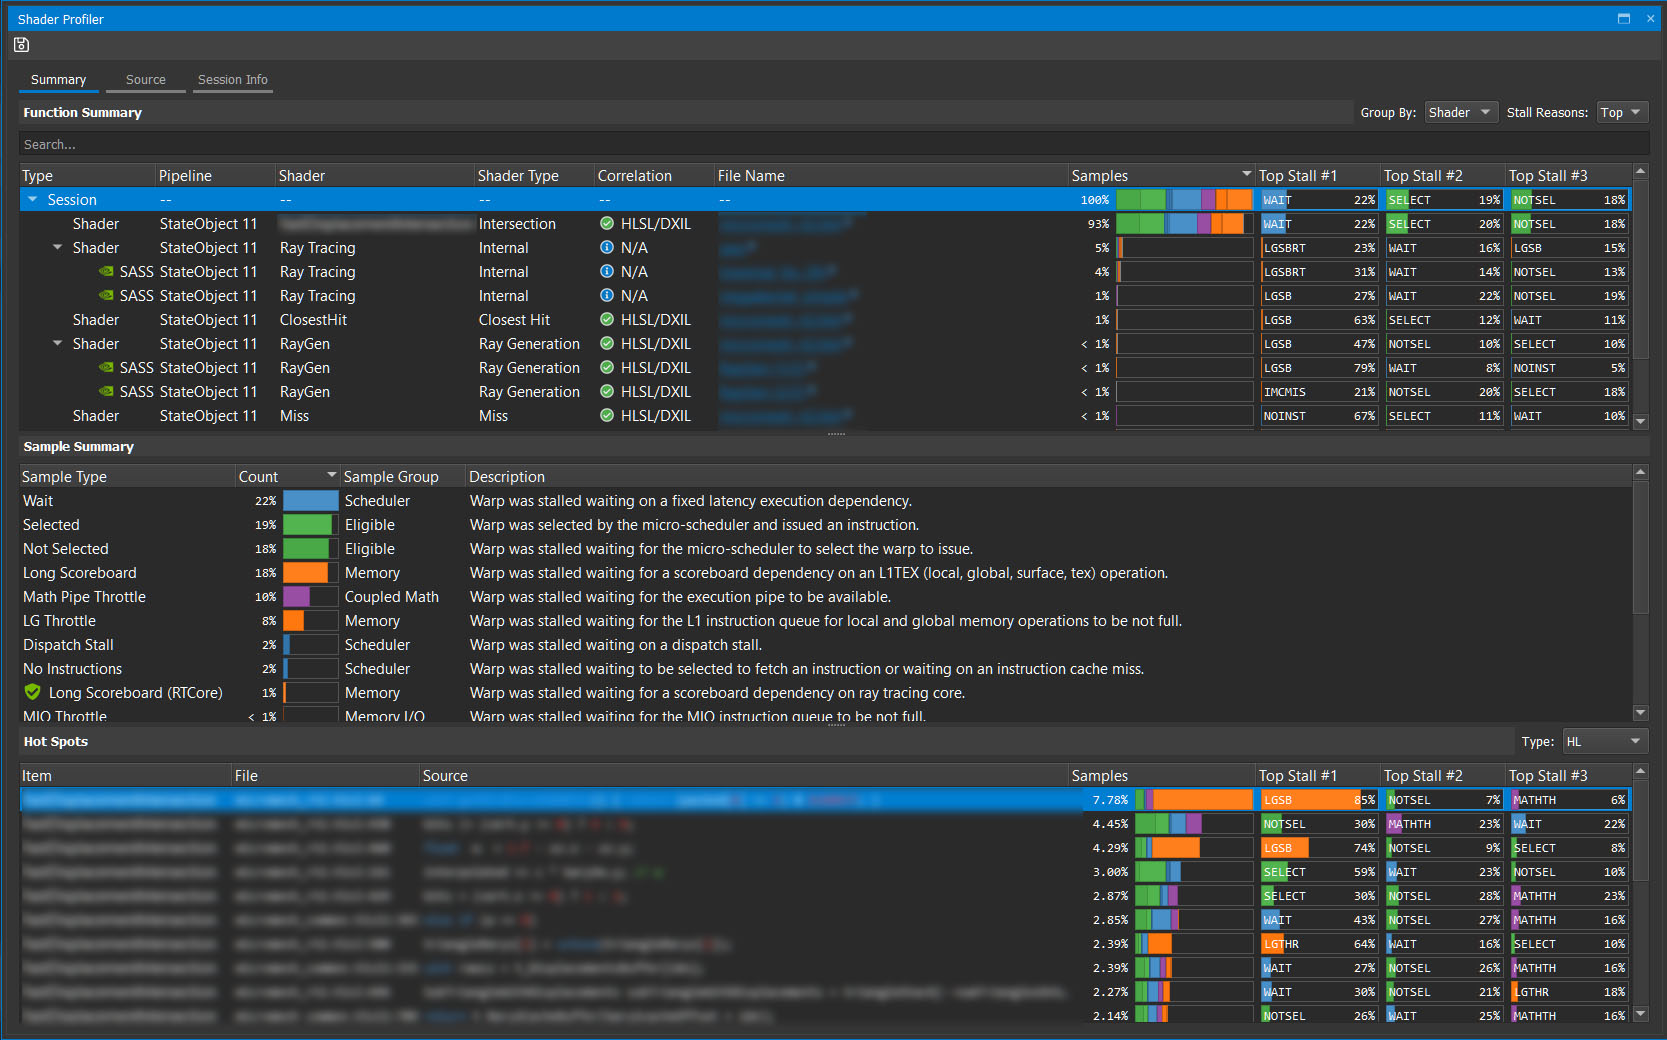
Here’s a breakdown.
The Function Summary shows a list of the top shaders, in order of the number of samples that hit those shaders. This is a good proxy for the shader latency and lets you concentrate on the shaders that can yield the biggest benefit from optimizing.
In the Correlation column, there are multiple green ticks, which are always good. In this case, it means that Nsight Graphics has been able to correlate the samples back to the source code.
To open up the shader view, select the first file name. On the left is the source code, and on the right is DXIL. For the purposes of this post, you don’t have to care about the DXIL, so change the view to just HLSL
It’s quite subtle, but there’s an important heat map of instruction samples on the far right, just to the right of the scroll bar. Remember, GPU Trace Analysis suggested that you should look for lg_throttle stalls. It said:
LSU is the unit that performs access to Local and Global memory.
Run the Shader Profiler and locate which HLSL instructions have most lg_thottle stalls.
Are dynamically indexed arrays declared in local scope?
Does the shader have register pressure causing spills?
If L1 and L2 hit rates are poor, then try to reduce misses.
In the Shader Profiler, the samples that show as LGTHR are stalled due to lg_throttle reasons.
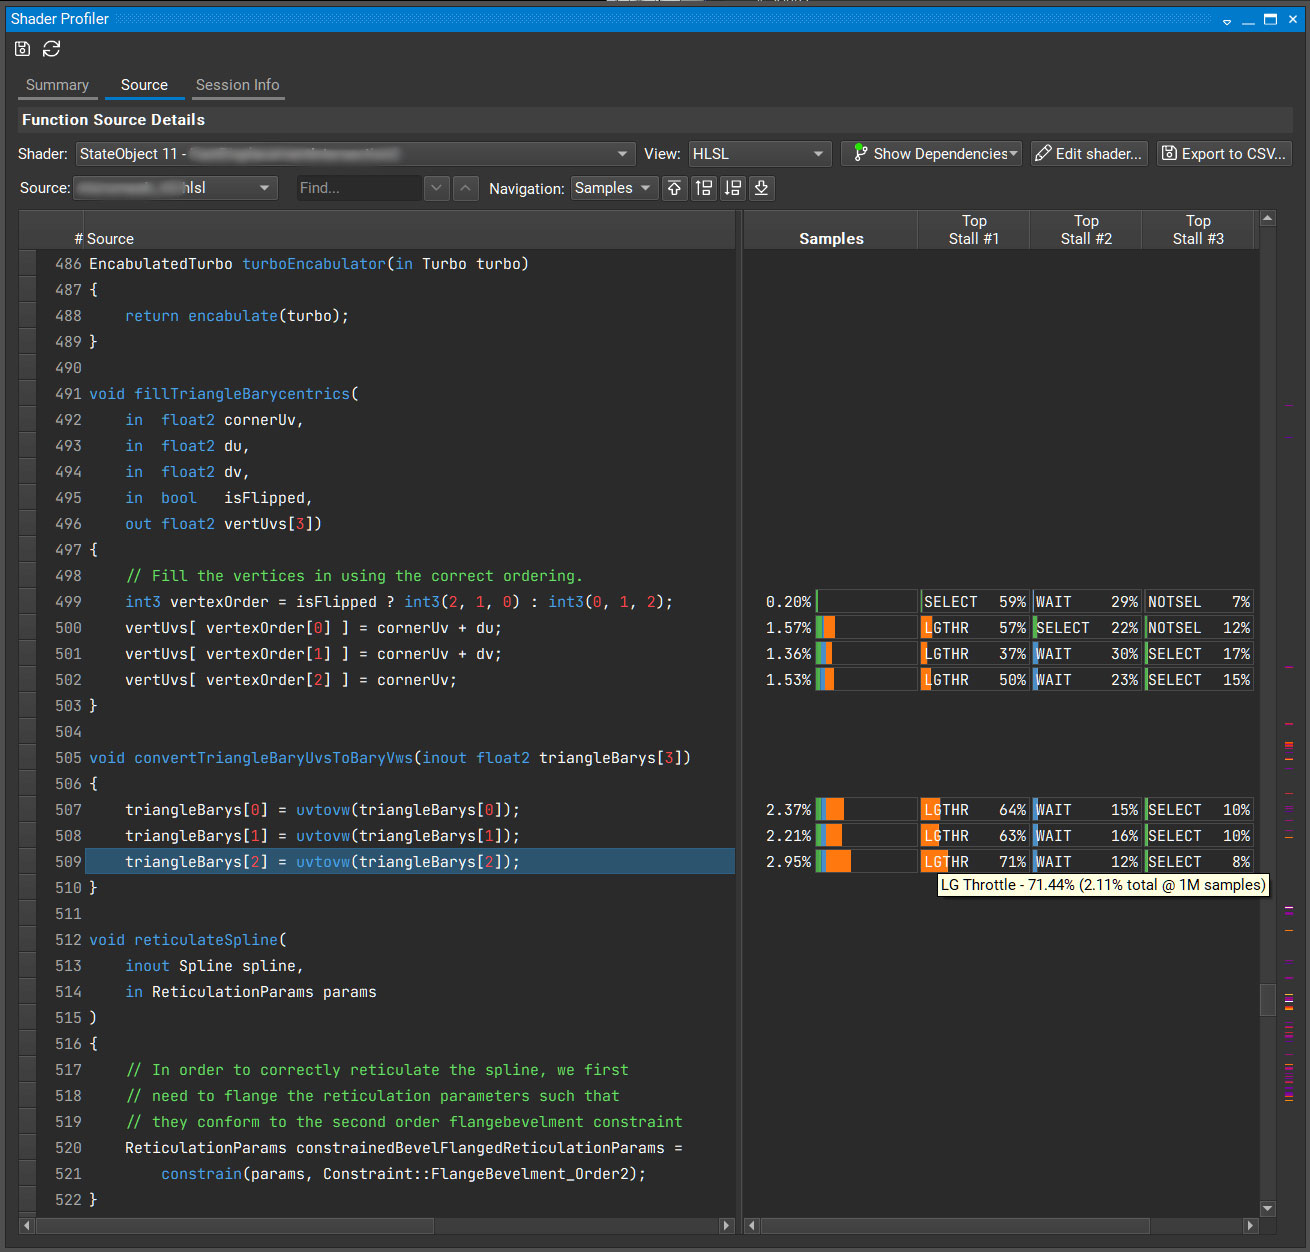
Are dynamically indexed arrays declared in local scope?
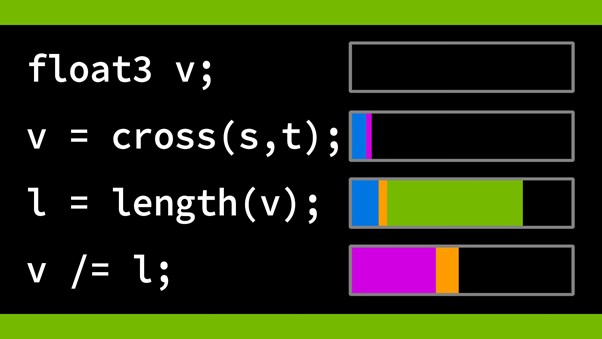
Dynamically indexed arrays are indexed by a variable, where the value of the index is not known at compile time. When this happens, the compiler often puts the array in local memory instead of having it live in registers. Memory is slower than registers.
The following code example shows a dynamically indexed array.
vertUvs[vertexOrder[0]] = cornerUv + du;
vertUvs[vertexOrder[1]] = cornerUv + dv;
vertUvs[vertexOrder[2]] = cornerUv;
What’s going on? It looks like the code fills in the array in a different order, depending on whether the triangle is flipped.
int3 vertexOrder = isFlipped ? int3(2, 1, 0) : int3(0, 1, 2);
The act of dynamically indexing this array makes the compiler move this array into memory. It affects this bit of code and all the bits of code that reference that array. That’s why convertTriangleBaryUvsToBaryVws is showing up as hot, too.
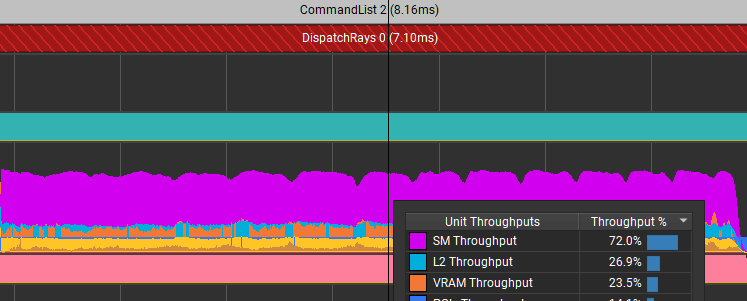
Can you do this without dynamic indexing? Yes, you can. Changing how the flip is done results in Figure 7.

Those particular stalls are eliminated. It reduced the time for this dispatch from 8.67 ms down to 7.1 ms. Not only did it improve the efficiency of shader code, but it also massively reduced the limiter in L2 because of the reduced memory traffic.
Summary
NVIDIA Nsight Graphics is a powerful tool for analyzing your rendering workloads. This has been a quick walkthrough, just touching on some capabilities. We highly recommend using it.
Disclaimer
The tests and results in this post were true as of driver version 467.07. Driver and compiler development continues all the time. That means that optimization opportunities can change over time, too.