NVIDIA Nsight Developer Tools provide comprehensive access to NVIDIA GPUs and graphics APIs for performance analysis, optimization, and debugging activities. When using advanced rendering techniques like ray tracing or path tracing, Nsight tools are your companion for creating a smooth and polished experience.
At SIGGRAPH 2023, NVIDIA hosted a lab exploring how to use NVIDIA Nsight Tools to debug and profile ray tracing applications. New versions of the NVIDIA Nsight Aftermath SDK, NVIDIA Nsight Graphics, and NVIDIA Nsight Systems are also available. For more information on Nsight Tools released at SIGGRAPH, check out the latest video on NVIDIA Graphics Tools.
This post explores how Nsight Aftermath SDK 2023.2 speeds up GPU crash debugging with improved event marker performance.
Nsight Aftermath SDK GPU crash postmortem analysis
Few issues are as pressing as a GPU crash, which can abruptly block development progress until resolved. Developers and end users alike find these crashes frustrating, especially when they can’t capture useful debugging information from the GPU pipeline at the moment of failure. To shed light on hidden exceptions, the Nsight Aftermath SDK opens a window into the GPU at the moment a game fails. This helps pinpoint the source of the issue and guides the developer in resolving it.
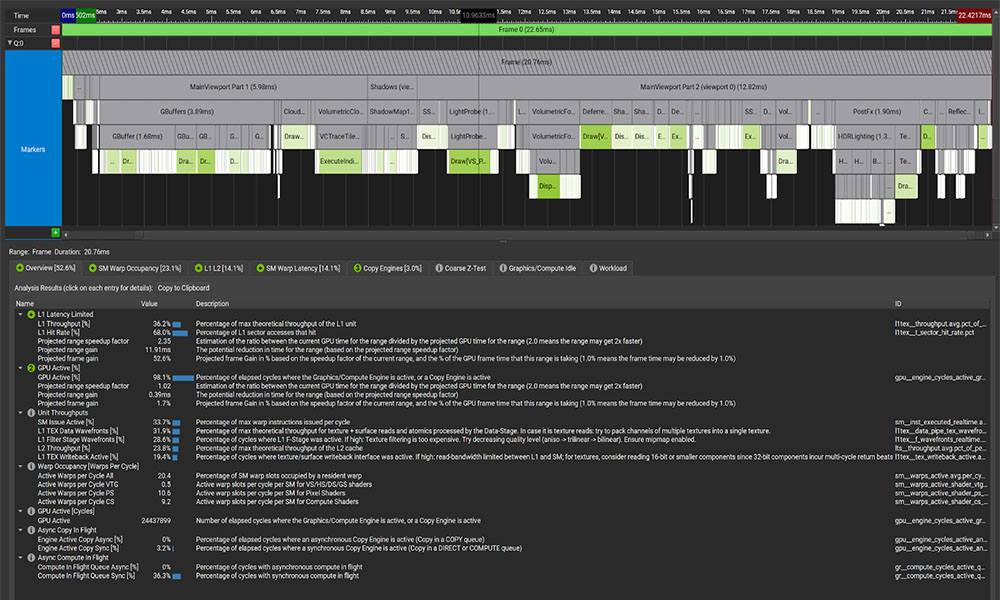
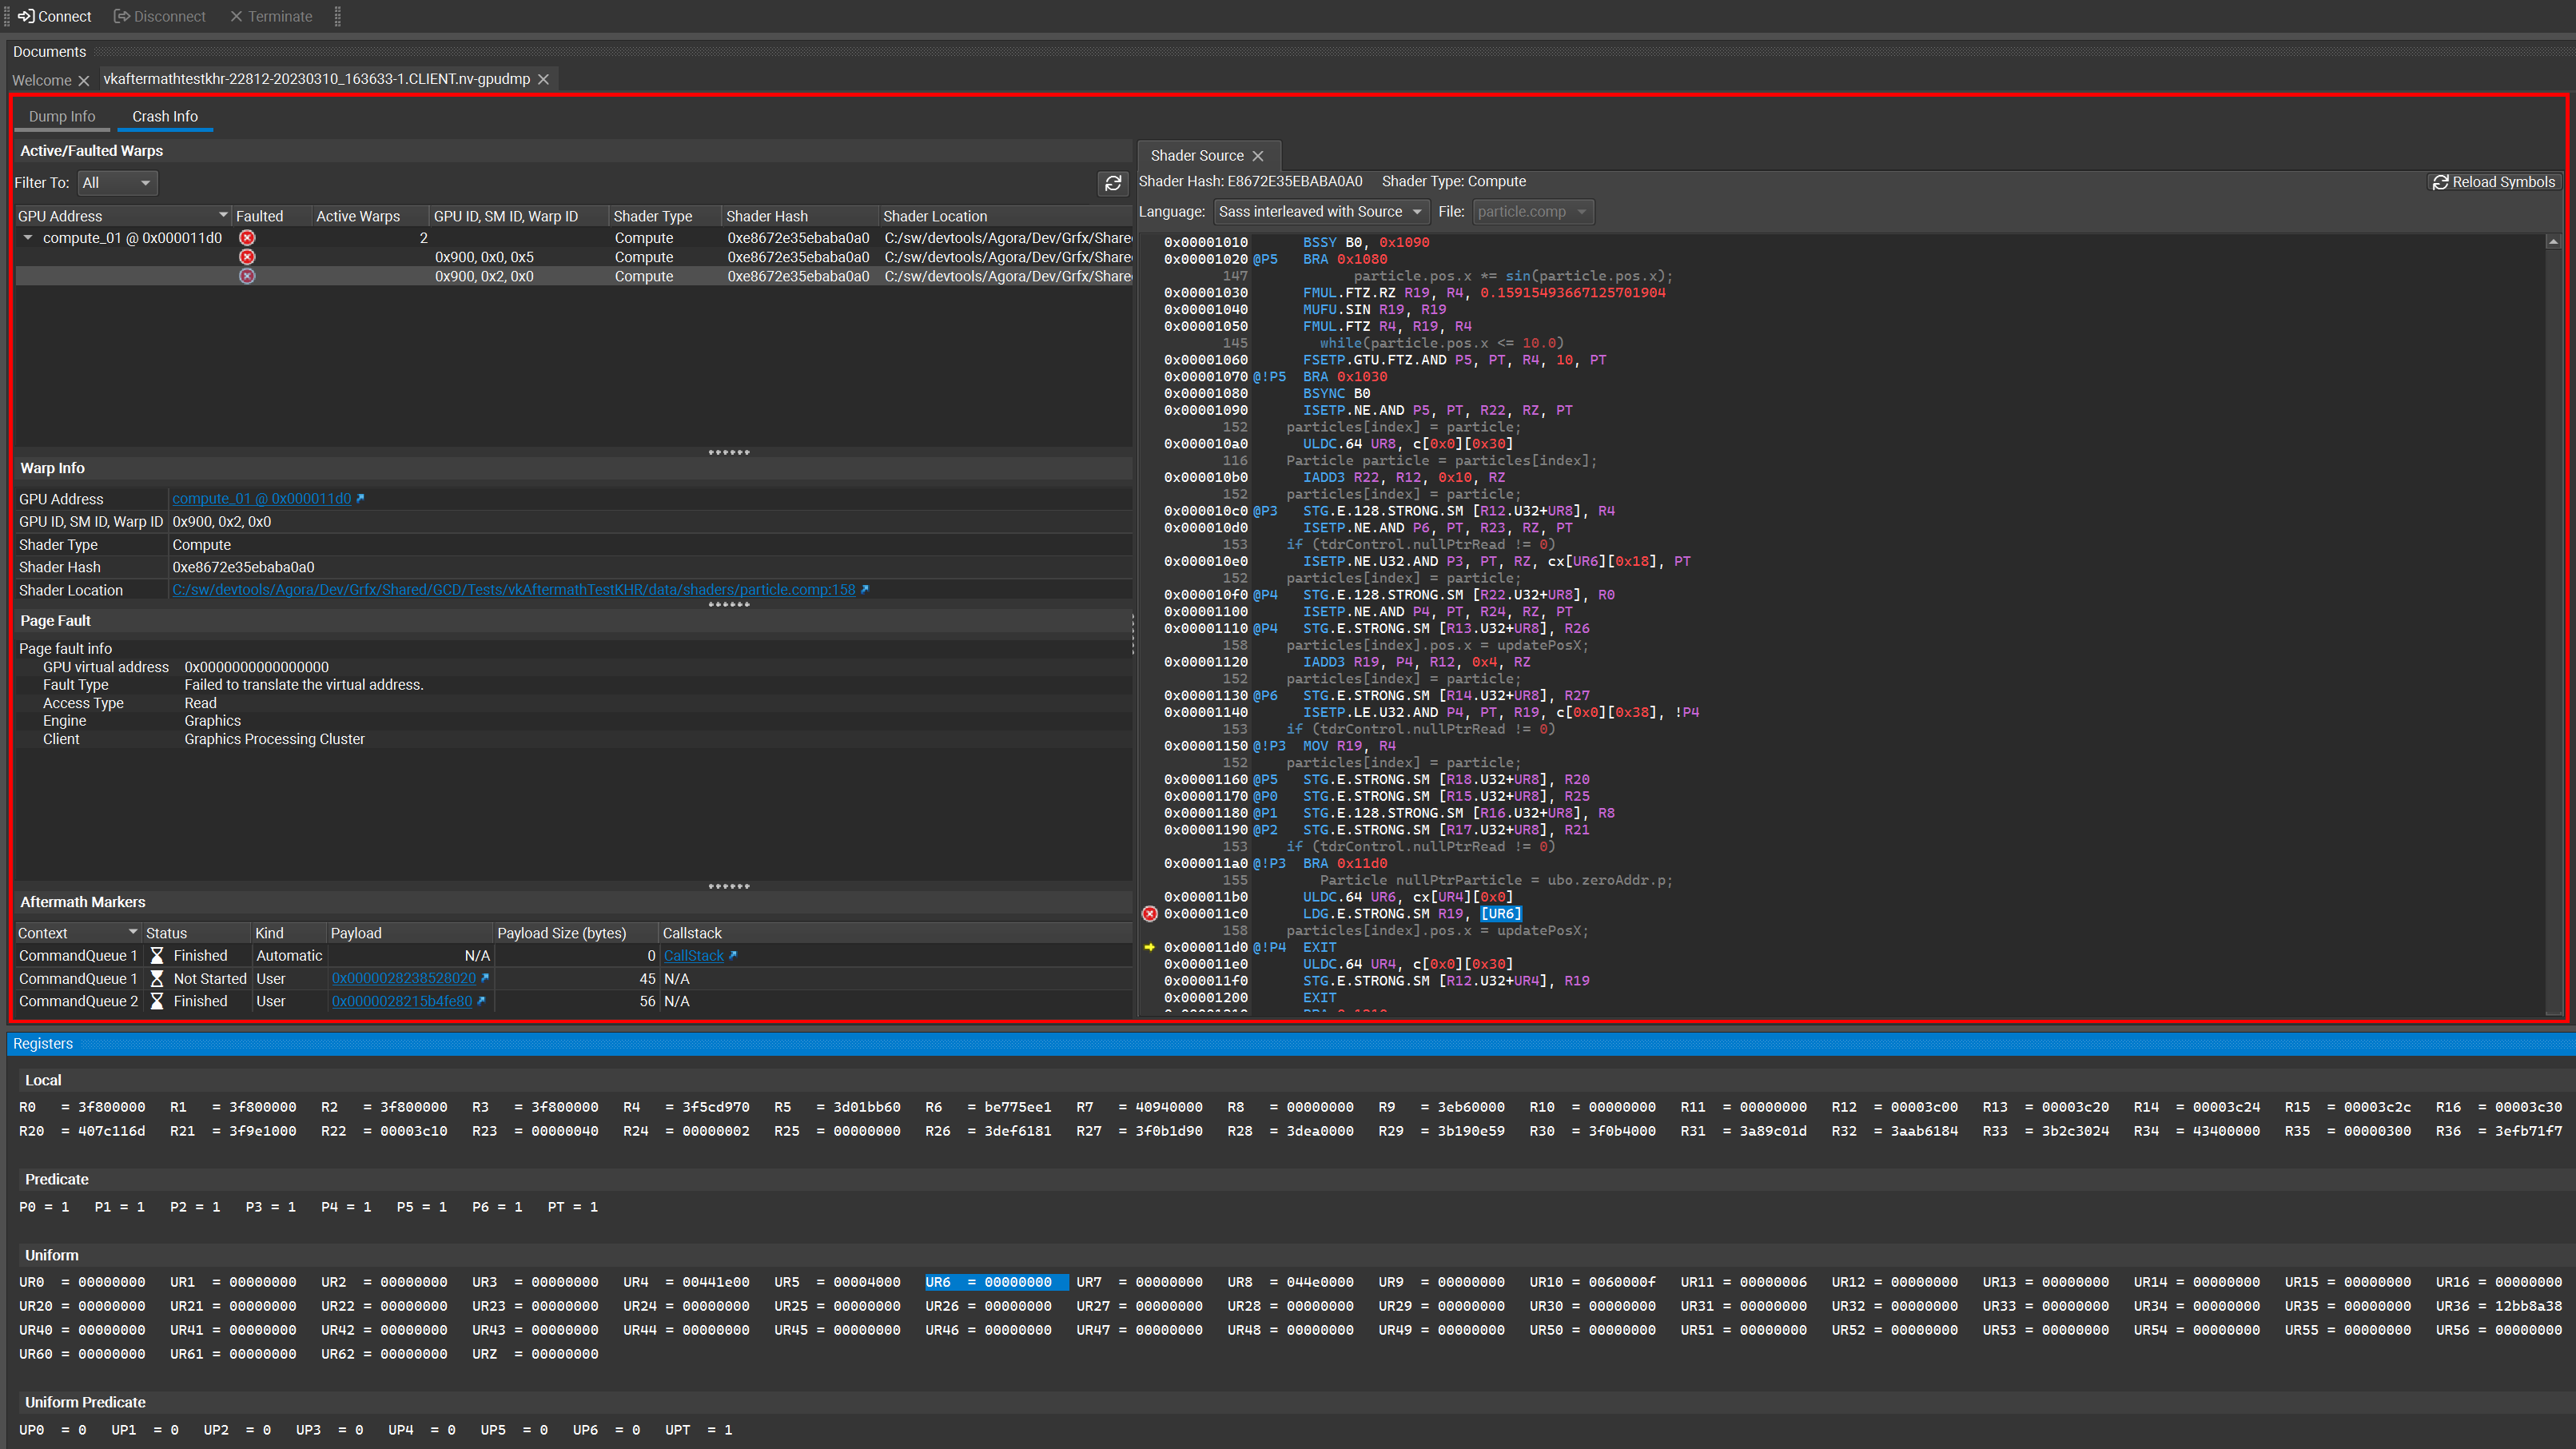
The Nsight Aftermath SDK generates GPU crash dump files that load into NVIDIA Nsight Graphics to visualize the GPU state—revealing MMU fault information, warp details, problematic shader source, and more. Integrating Aftermath into existing crash reporters also provides more granular pipeline dumps from end-users’ machines, providing actionable reports. Today’s update to the Nsight Aftermath SDK improves the contextual data provided through low-overhead, application-specific markers.
Event marker performance has been enhanced in the Nsight Aftermath SDK for DirectX 12 applications. You can insert these markers into your CPU code at desired intervals, and the significantly reduced overhead makes them usable in shipping applications. Markers are written to the Aftermath crash dump file, indicating where in the application’s frame a GPU exception occurred. With this information, you can determine the workload executing on the GPU and view what shaders were in use at the time of the crash.
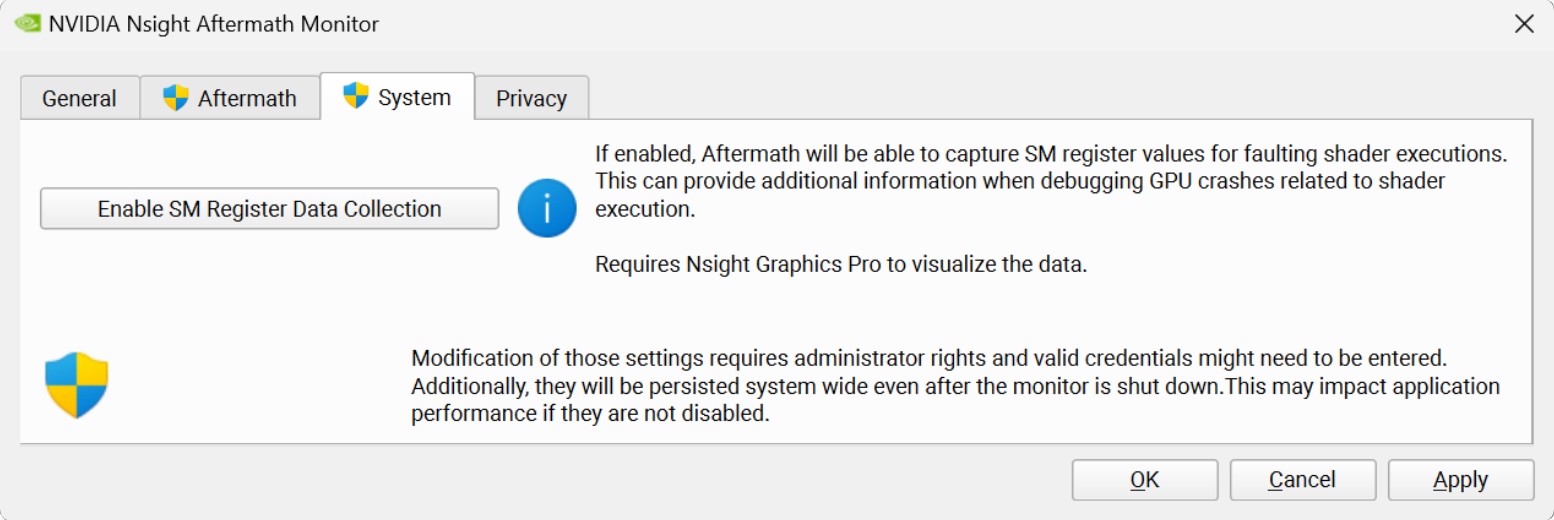
The 2023.2 version of the Nsight Aftermath SDK also supports collecting and displaying shader register values to aid in debugging streaming multiprocessor (SM) exceptions. On the SM, registers store the results of instructions as they are executing. This data is particularly relevant to determining the source of a crash if a shader workload triggered the failure. After being written to an Nsight Aftermath dump file, you can inspect the register values for faulting threads in Nsight Graphics. This helps you determine where and why the shader execution failed.
SM register data is now available for DirectX 12 and Vulkan applications. Note that viewing this data requires NVIDIA Nsight Graphics Pro. Coordinate with your NVIDIA Developer Technologies or Developer Relations contact, or reach out, to request access.
Nsight Aftermath is also now compatible with the latest applications using cutting-edge DirectX12 features through the DirectX Agility SDK.
Getting Started with Nsight Aftermath SDK and event markers
Getting started with the SDK is easy. Here are some tips to help you use GPU crash dumps and event markers. More information is included in the Read Me section of the download.
- Download Nsight Aftermath SDK 2023.2.
- Enable GPU crash dump creation by calling
GFSDK_Aftermath_EnableGpuCrashDumps. Note that crash dumps won’t be made for devices generated before that call. Make sure it’s enabled first. - Set the Nsight Aftermath options to control what information is captured.
For example, you can enable shader debug information and runtime shader error reports “flags” when you initialize Nsight Aftermath for the device.
Tip: To use event markers, make sure that the event marker flag is enabled at this step. You can also use the Nsight Aftermath Monitor application to enable SM register collection.
- When your GPU dump has been collected, open it up with Nsight Graphics for rich data visualization. Nsight Graphics will help you analyze the crash and determine how to resolve it.
Tip: the Aftermath API provides a simple and lightweight solution for inserting event markers on the GPU timeline. To keep CPU overhead to a minimum, you can set dataSize=0 to instruct Aftermath to rely on the application to manage and resolve marker data itself.
Download NVIDIA Nsight Developer Tools
Download all of the new Nsight Developer Tools announced at SIGGRAPH.
Dive deeper or ask questions in Developer Tools forums or learn more about graphics development with Nsight Tools at SIGGRAPH 2023.