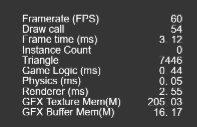
Hello everybody, I have a question regarding optimization. While my game runs at 60 fps for the most part, there are sudden frame drops happening every now and then. I check the profile stats from Cocos and I noticed that rendering takes up a good amount of the frame time.
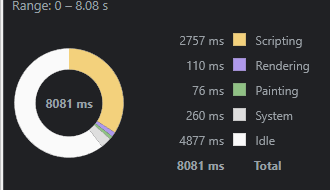
However, when I profile my game using Chrome it shows that scripting takes up the most amount of time.
Should I optimize rendering or scripting? Any feedback will be appreciated.
That depends on platform, on web which you inspected, renderer time doesn’t contains GPU time, it’s all the time for the execution of the JavaScript renderer code. However, on native platform renderer time contains GPU time, because the profiler time counter wait until GPU present, which is no way to do on web.
Anyway, which our profiler count is mostly CPU time by JavaScript execution, so it matches what you see in Chrome performance.
Normally the renderer time is the engine logic, what you can do is to reduce draw call and elements in project level. Otherwise, game logic is what you should focus on
Thanks for the response. I’ll keep this in mind.
